| Note: This tutorial assumes that you have completed the previous tutorials: Installation. |
| |
Running the YRL
Description: Establishing the connection to the YRL LiDAR and verifying point cloud publishingKeywords: network setup, execution, verification
Tutorial Level:
Next Tutorial: Viewing LiDAR point clouds with RViz
Contents
Tutorial Description
This tutorial describes how to establish the connection to the YRL LiDAR, generate a calibration file, run the driver and verify proper operation by checking the point clouds published.
Setting up the connection
The required steps follow the instructions of the "Quick-Start Guide" provided in print with every YRL. It is also available digitally on the YRL website: http://lidar.yujinrobot.com/
First, supply the YRL with power. The status LED will start blinking green during start-up followed by a constant green. Then YRL starts spinning.
Next, attach the data cable to the YRL and plug the Ethernet connector into your machine. For successfully establishing a connection, your machine requires an IP address in the 192.168.1.XXX space. The YRL uses 192.168.1.250 by default. So choose another another IP for your machine, such as 192.168.1.42.
Generating the calibration file
For the YRL to properly produce point clouds a calibration is required. For this the "Yujin LiDAR Viewer" is used to generate the calibration file, which is then loaded by the driver. Note, that this process has to be done only once.
The "Yujin LiDAR Viewer" is part of the "yujin_lidar" repository, which has been downloaded as part of the installation tutorial.
To start it, navigate to the viewer directory from your catkin workspace root, make the viewer executable and start it with sudo rights.
$ cd src/yujin_lidar/yujin_lidar_viewer_ubuntu1804
$ chmod +x ./Yujin_Lidar_Viewer
$ ./Yujin_Lidar_Viewer
With the viewer open connect to the LiDAR.
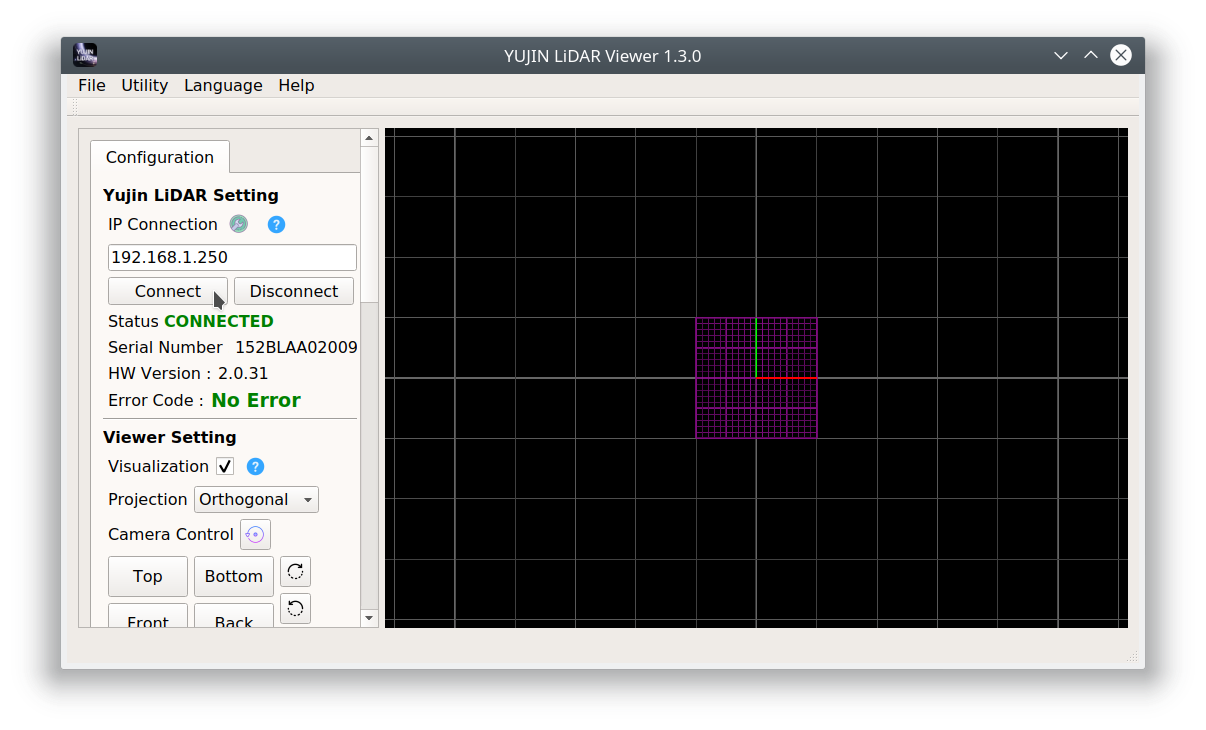
Then generate the calibration file ("Utility" -> "Create a Calibration File").
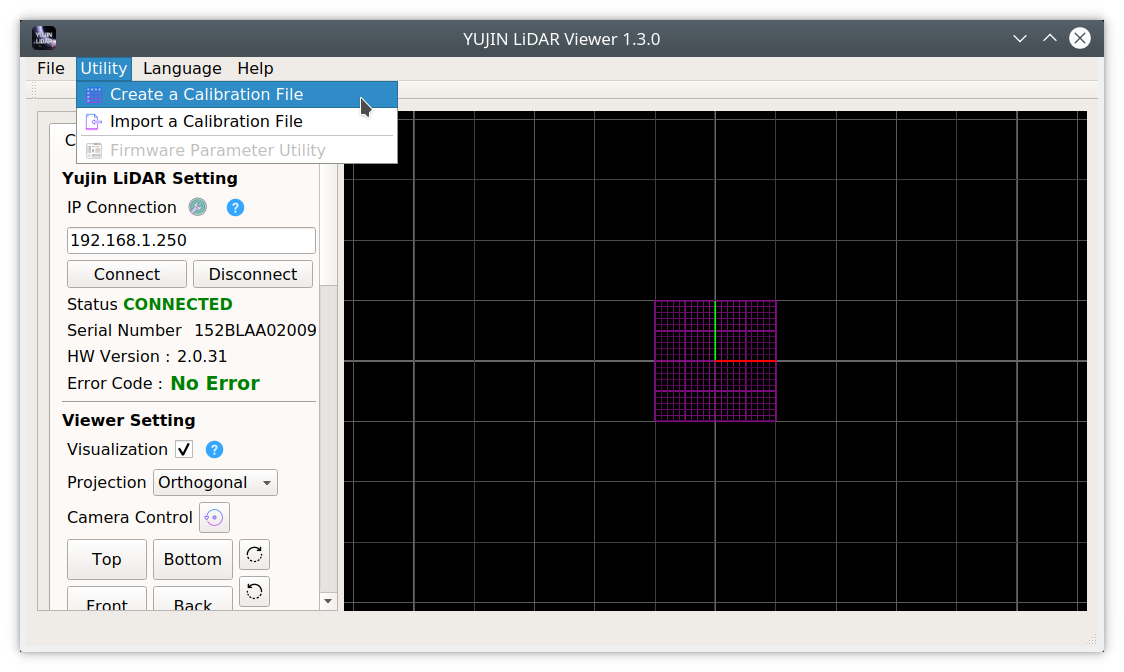
The viewer will then generate the file.

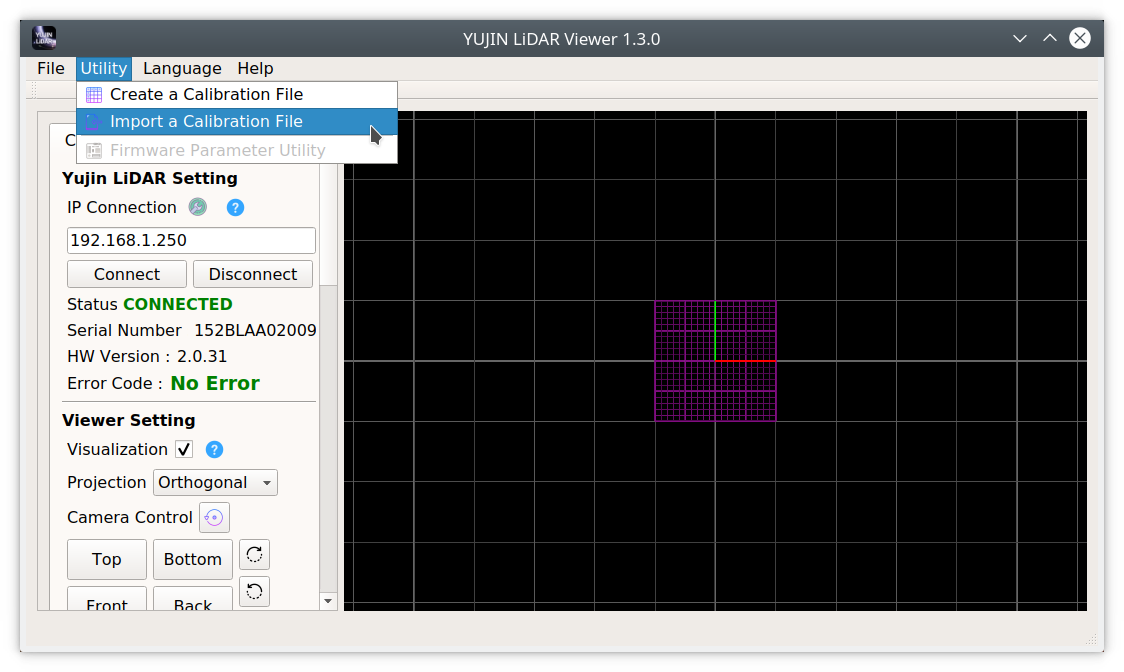
Next, load the generated calibration file ("Utility" -> "Import a Calibration File").
Select the generated file located in the folder from where the viewer has been executed. Its name follows the format "lk<serial number>.bin".
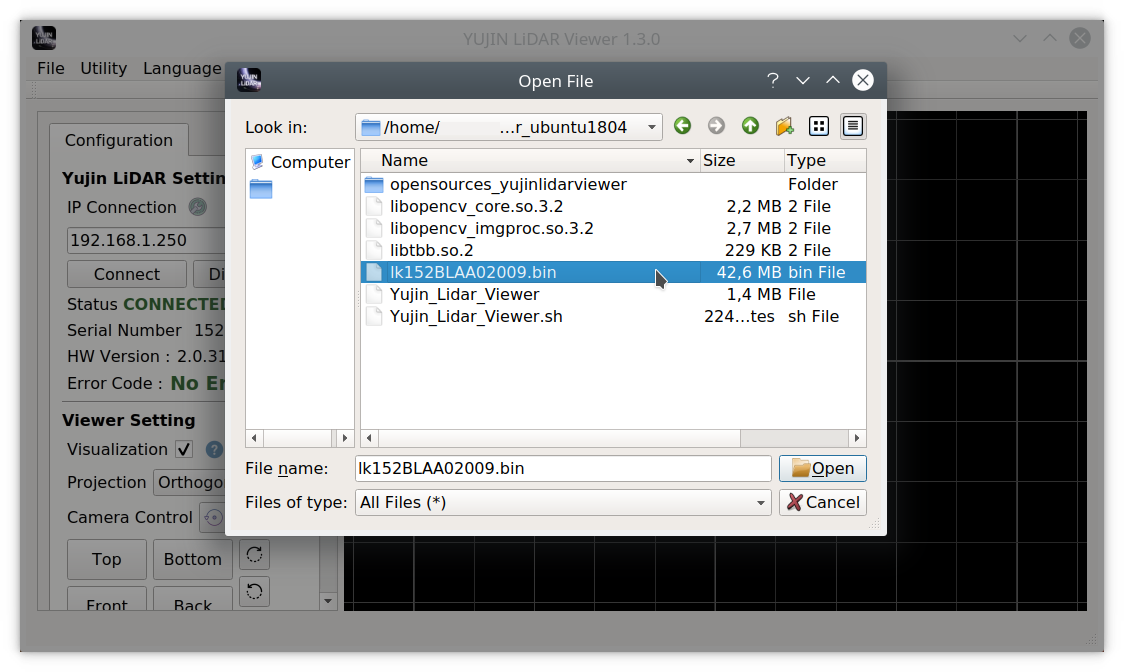
Once the file has been loaded the viewer starts visualizing the point clouds captured by the YRL. Feel free to close the viewer.
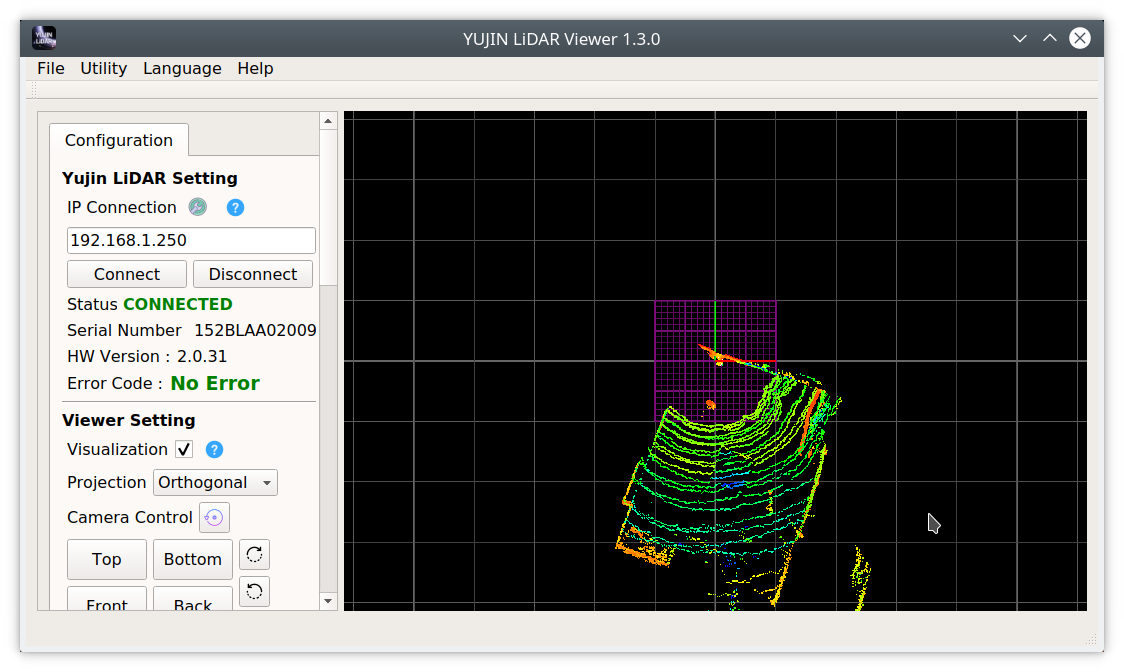
Next, create a copy of the generated calibration file named "lk.bin" and move it to the folder from where the YRL driver (ROS node) will be executed:
$ cp lk152BLAA02009.bin lk.bin
$ mv lk.bin ~/ros/catkin_ws/devel/lib/yujin_yrl_package
Running the driver
For publishing point clouds two terminals are required: one for running the ROS core and one for the YRL driver.
In the first terminal, source your ROS environment and start the ROS core.
$ source /opt/ros/melodic/setup.bash
$ roscore
In a second terminal, source your ROS environment making sure that it includes the workspace containing the Yujin YRL package. For example:
$ source /ros/catkin_ws/devel/setup.bash
Then navigate to executable of the driver and run it.
$ roscd
$ cd lib/yujin_yrl_package/
$ rosrun yujin_yrl_package yrl_pub
Note, that the driver expects a calibration file named "lk.bin" to be located in the folder from where you execute the command above.
A successful connection to your YRL should look similar to this:
$ rosrun yujin_yrl_package yrl_pub
3D Model
MODEL YRL3-20 Connected
Verifying point cloud publishing
For verifying point cloud publishing a third terminal is required.
Source your ROS environment and use rostopic to output the published point cloud message.
$ source /ros/catkin_ws/devel/setup.bash
$ rostopic echo /yrl_pub/yrl_cloud
The terminal should show output similar to this:
$ rostopic echo -n 1 /yrl_pub/yrl_cloud
header:
  seq: 1290
  stamp:
    secs: 1609697104
    nsecs: 438788383
  frame_id: "yrl_cloud_id"
height: 1
width: 570
fields:
  -
    name: "x"
    offset: 0
    datatype: 7
    count: 1
  -
    name: "y"
    offset: 4
    datatype: 7
    count: 1
  -
    name: "z"
    offset: 8
    datatype: 7
    count: 1
  -
    name: "intensity"
    offset: 12
    datatype: 7
    count: 1
is_bigendian: False
point_step: 16
row_step: 9120
data: [165, 204, 74, lots of more numbers ...]
is_dense: True
---


